Teacher Showcase: Edcite-formatted Exams with Katherine Jensen

Check this out to hear about Katherine Jensen, Northview math teacher, adminstering semester exams in Edcite for better AIR test prep.

PARCC and AIR tests have caused their due portion of stress and anxiety for all of us, but after years of adjustment, they’ve also led to some noticeable instructional changes in our classrooms. One such change, which Sylvania teachers are adjusting to more and more every day, is the implementation of digital tests and quizzes. Going digital allows students to become used to completing challenging work on a Chromebook. But, of course, that only really helps them prepare for AIR tests if the digital activities push past the traditional multiple-choice model of assessment. Assessments that include drag and drop items, graphing tools, sentence select interactions, and more are necessary to really prepare students for the tests. Google Forms doesn’t do the trick, and the rest of the free and premium digital landscape is pretty scant.

EdC Alg SC 1.png
An Algebra test item with the equation editor function

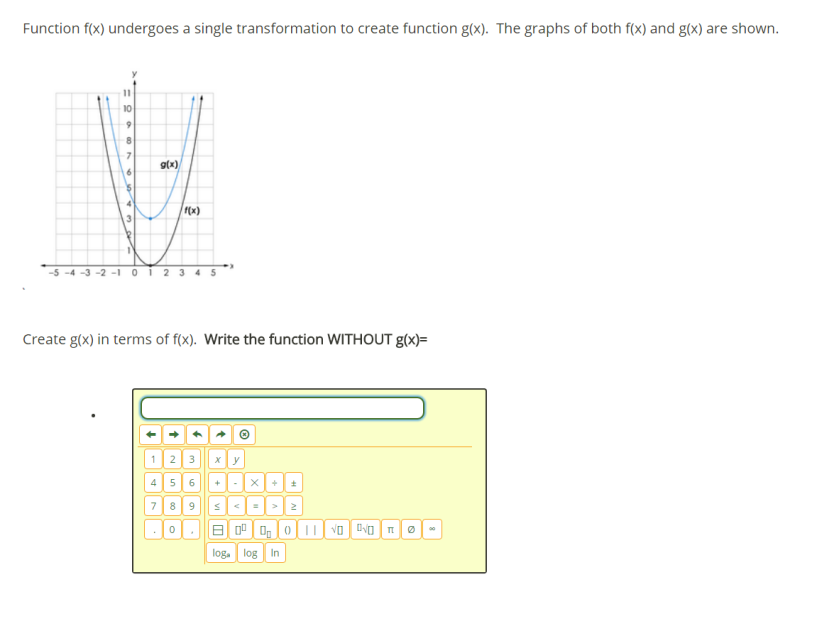
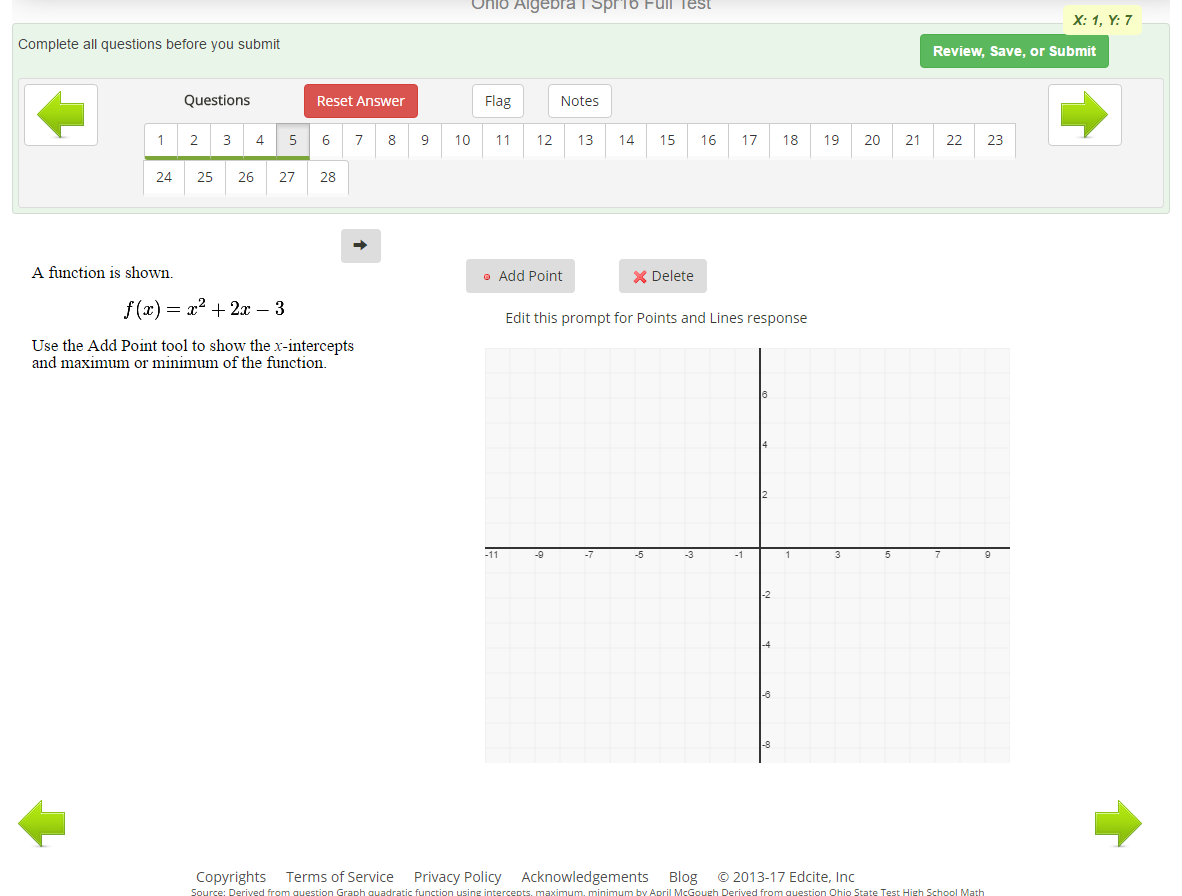
But, Katherine Jensen, math teacher at Northview High School, is figuring out how to solve that problem and give her students digital assessment experience. This past semester, Katherine developed her exams for her Algebra I and College Prep Math students through Edcite, the free digital assessment platform that offers nearly seventy different digital question types, many of which are explicitly aligned to AIR, PARCC, and Smarter Balanced state tests. She used three to four different question types per exam to give her students a variety of interaction with math tasks. So, this year, instead of bubbling in Scantron sheets, students were clicking mice. Instead of drawing with pencil on graph paper, they were plotting points and dragging lines on digital coordinate planes. The impact ranged from null to huge.

EdC Alg SC 2.png
An Algebra test item with the graphing tool function

On the null end, Katherine did not notice any appreciable difference in grade results. Students were demonstrating the same sorts of mastery they demonstrated on paper exams. In the middling range, Katherine was grateful to avoid fussing with Scantrons, both in organization and grading. She and her students received instant feedback on structured response items, and Katherine also had instant access to detailed and user friendly grade reports. The tests were also much simpler to modify in the case of errors or improvements; changes are instantly available to students with no worries about returning to the photocopier or announcing changes. On the huge end, students were interacting with the same digital tools they will use when facing their AIR tests in March and April, but they weren’t doing it in some detached, artificial test preparation environment. They were doing it in the course of regular instruction, a seamless approach to state test prep.

EdC Alg SC 3.png
An Algebra item requiring a written response

Katherine is excited to continue with digital assessments through Edcite, and she’s already developing more. While she admits that the learning curve for Edcite content development may seem steep, once question types are learned, creation become simple. She’s interested in learning from some minor problems with the exam (like students using the x for multiplication instead of the x for variables in the equation editor) and adding more writing activities. Whatever course her work may take, one thing’s for sure. Her students will walk into a testing room better prepared to succeed than many of their peers around the state.


Teacher Showcase: Digital AP Math with Greg Christy

In AP Statistics and AP Calculus, Northview’s Greg Christy uses digital tools to help students understand the concepts behind the equations.

Northview math teacher Greg Christy opens his AP Statistics class with a simple question: “Have you all had your tetanus shots?” After one lost soul asks, “What’s a tetanus shot?” Greg begins distributing thumb tacks. He jokes a little about this lesson being “the most dangerous thing you’ve done today, maybe all year,” but he quickly moves past these quips to instructions for the lesson. Students will use these thumb tacks to explore the move from randomness to probability, a chapter 14 lesson. And while doing that, they will use simple, yet powerful spreadsheet tools in Google Sheets to calculate.

Here’s the sequence: Greg has created a spreadsheet and shared it with all of his students, giving them edit access. He displays it on the SmartBoard and they open it on their Chromebooks. Then, the students toss the tacks at their desks for a trial of twenty tosses, laughing as they do so, but recording the results carefully. On the shared sheet, they record the percentage of “tips up” landings in the column next to their name. A second trial of twenty tosses follows with a second entry. As the students enter data, it appears on the class screen live, as does another number, the long-run relative frequency of “tips up” landings. Greg has designed the sheet to calculate the average percentage of these landings, and as the numbers keep flowing in, the percentage evens out to about 63%.


The practical test and collaborative data recording have given Greg the introduction he needs to discuss several concepts in probability and statistics, such as trial, outcome, sample space, Law of Large Numbers, empirical probability, and theoretical probability. All the while, he goes back to the Google sheet, explaining the meaning behind the numbers. He adds to that discussion by pulling up graphic representations through histograms and Google’s new “Explore” feature in sheets. Using the latter, students can see how trials over a space of time even out to a nearly flat line. The numbers in the original sheet become empirical probability, and the tossing of tacks becomes a conceptual reality for these students.

By using Google sheets and the collaborative spreadsheet power they provide, Greg has brought students into the development of large number data to yield conclusions regarding probability. Rather than reading these results passively, or watching a demonstrated trial, the students participate in the work in real time with immediate impact. Greg extends that engagement when he shows students how to generate long lists of random numbers on their own sheets with the “randombetween” function. Even this little trick helps students visualize the concept. As Greg says, “It helps them to make a connection conceptually with what they’re doing analytically.”

20151116_130428
Greg guides AP Calculus students through digital graphing.

That connection does not just happen in AP Statistics, though. It also happens in AP Calculus. The day before the tack lesson, Greg was helping his AP Calculus students visualize the concept underlying polynomial function rate of change. Students are familiar with these concepts (e.g. derivative, concave up/down, decreasing/increasing) and are ready to graph the rate of change of a function based on its graph. Today, Greg does not rely on Google, which is too general for calculus. Instead, he relies on NCTM’s Illuminations resources.

Interactive Calculus Tool
The NCTM Illuminations Interactive Calculus Tool

At the SmartBoard, Greg models the Interactive Calculus Tool available in Illuminations. Students follow on their Chromebooks as he graphs the function and then tries to anticipate the derivative. Once he has shown them, he asks that they create their own function graphs to trade with partners for derivative graphing. The students love this step, and one hands his Chromebook to the student behind him with a smile and a warning: “This is brutal.” Everyone tries to graph the derivatives for the polynomials given to them as Greg circulates and answers questions. As the class progresses, students work a problem described on the handout Greg gave them.

20151116_131526
Greg provides guidance to two students as they work through graphs on NCTM’s Illuminations utility.

So what’s the big deal here, and is it big? These two lessons might beg a math teacher to ask how going digital with either Google or Illuminations has significantly improved the learning experience for these AP students. According to Greg, “We do a lot with analytical equations. That’s by hand. Our technology allows us to take those equations and create graphs of those. That’s all based on analytical methods, but with those analytical methods, the students don’t get an intuitive feel for what’s happening.” As he explained before, the students are better able to grasp the concepts when manipulating them through dynamic digital tools. The concepts, which may be elusive when navigating complex equations, appear clearly on the screen. On the AP Calculus test, Greg explains that the test asks “questions on a conceptual basis . . . There’s not a lot of it that’s just rote mechanical operations. Even though the testing environment is traditional, the conceptual foundation still needs to be there. It does transfer. If it didn’t, I wouldn’t do it.”

These digital tools are not simply relevant to Greg’s AP classes. NCTM offers Illuminations content to a wide range of math classes and skill levels. Google Sheets can help student visualize mathematical relations with similar variety. Greg has simply shown how digital interaction provides easy and powerful tools for working with numbers in a hands-on, engaging fashion.

TS Sequence Slide-Christy-2.jpg

TS Sequence Slide-Christy 1.jpg

Follow these links for more information!

NCTM Illuminations Home Page

NCTM Illuminations YouTube Channel

NCTM Illuminations Function Matching Tool (Excellent tool for a wide range of secondary math classes)


Teacher Showcase: Video Recorded Math Reflections with Julie Young

Traditional math reflections become awesome when Julie Young’s students create them through MoveNote!

Julie Young, math teacher at Arbor Hills, advises her students to “use your words.” The joke tells the truth of the project her eighth grade Math II students are beginning today. Instead of them crunching numbers with pencil and paper as usual, these students are about to explore how words and images can be used to express their understanding of math concepts. That may sound like a traditional math reflection, and at its heart, it is. But today, Julie is about to inject the typical math reflection assignment with a dose of digital through MoveNote and Google Slides.

Before class, students have completed a short worksheet on finding the slope of a line using equations. Now, Julie asks them to take that traditional math work and create a recorded presentation exploring the process of finding the slope. In a sense, students are creating short lessons. In fact, as they begin to design their slide presentations for the project, they look just like teachers designing a lesson. The slide presentations will be joined to a video recording of the students delivering the material through MoveNote. The final product will be a recording that places the students in positions of expertise on the math concept at hand.

20151102_090216
Students mix worksheet activity with Chromebooks.

Julie has partnered the students for this project, and on this day, they workshop the worksheet and presentation file, and some practice their delivery. Some will even get to the recording, but most partnerships spend the period in this pre-recording development.

And that development is rife with experimentation and discovery. After Julie challenges the students to include graphs in their presentations, some play with Google Drawing, fashioning their own graphs to accompany equations. Others find the graphs through Google Images. They discover that if you enter the equation as the search query in an Image search, the graph of the line will appear. Many use that trick to find graphs for their slide presentations. Still others add to that the trick of clicking and dragging the image from the search directly into the presentation without the extra steps of saving to a separate location.

In their desks and on the floor, students collaborate under Julie's guidance.
In their desks and on the floor, students collaborate under Julie’s guidance.

Throughout the period, students laugh and smile as they work. Julie floats throughout the classroom, observing and answering questions. Her student teacher, Maria Nielsen, does as well, but the students do not ask for their assistance often. They work well, and most of them demonstrate the best of collaborative student learning. They encounter challenges, discuss them, and develop solutions. In the process, they often learn much more than simply how to find the slope of a line. They learn Internet work skills, presentation design principles, and teamwork values.

If you step back from this activity, you’ll realize that Julie has not done anything dramatically new in curricular terms. Students have been expected to demonstrate their understanding of math concepts through reflection assignments for some time. Through the reflection, students assume the voice of authority, a voice that requires mastery of concept. Here at Arbor Hills, though, that traditional assignment has taken a leap. The power of Julie’s approach is to leave behind the typical English composition approach of the reflection. In its place, she has inserted student collaboration and modern tools of expression that key on multiple learning styles. The simple focus on MoveNote as a method for expression has made a huge difference in the learning of these eighth grade students.

Student partnerships at work.

As they pack up for the day, the smiles continue, as do the laughs. These students have enjoyed themselves this class period, which is really an easy enough accomplishment for a teacher. Julie’s triumph, though, is the learning that was evident in the work they completed as they smiled and laughed. Julie has made slope finding fun and accessible. No doubt because of that, these students will retain that skill for years to come.

TS Sequence Slide-Young.jpg

Explore these links for more!

SDL Page on MoveNote

Sample Student Presentation-coming soon!

Sample Student Recording-coming soon!

Julie’s Worksheet File

Julie’s Rubric File

PD Session: Chromebooks and the Math Classroom

What math content can you enhance with Chromebooks in your classroom? What lesson can’t you enhance!?!

Presented by Greg Christy and April McGough

Presenting last on October 19, 2015 as part of the Sylvania Fall Inservice Day. Next presentation to be announced!


From the ad: “What math content can you enhance with Chromebooks in your classroom? What lesson can’t you enhance!?! Learn the finer points of MathXL–for Algebra 1, Geometry, and Algebra 2–and get introduced to (or reacquainted with) NCTM Illuminations that can be incorporated in courses from Algebra 1 to Calculus and everywhere in between.”

Participants will walk out with a variety of online resources that can be utilized to differentiate content and educate students with engaging, 21st Century tools.


Why Illuminations?


Session Materials

October 19, 2015 Presentation

NCTM Illuminations

MathXL

PD Session: You Can Do It with Khan Academy!

Do you need resources to help your math and science students master specific content? Want to get your students actively engaged in learning while differentiating instruction?

Presented by Greg Christy

Presenting last on October 19, 2015 as part of the Sylvania Fall Inservice Day. Next presentation to be announced!


From the ad: “Do you need resources to help your math and science students master specific content? Want to get your students actively engaged in learning while differentiating instruction? This session is all about how Khan Academy can spice up your classroom while increasing student success.”

In this session, math and science teachers will learn how to use Khan Academy both as an in-class resource for instruction and differentiation, but also as a support for out of class review. Teachers can direct students to certain videos to help them learn material or assign additional practice to help them master concepts.


Couldn’t make the session?  Check out this video from Khan Academy!


In Khan Academy’s own words:  The Khan Academy Student Experience


Session Materials

Monday, Oct 19 Presentation

Khan Academy Webpage

Khan Academy Set-up Instructions

PD Session: Mathematics and the Digital World- What can WE do?

Looking to make a DIFFERENCE educating students in your math class? This session will help you ADD some cool digital activities to your math class

Presented by Karma Vince and Julie Young

Last presented on October 19, 2015 as part of the Sylvania Fall Inservice Day; Next presentation to be announced!


From the ad: “Looking to make a DIFFERENCE educating students in your math class? This session will help you ADD some cool digital activities to your math class. Come and brainstorm your ideas with Math teachers Karma Vince and Julie Young. ”

Description- In this session, math teachers will share and discuss digital activities and strategies for 6-12 math classes. The session will focus on sharing and brainstorming, rather than a set lecture. Come to learn and share or just to learn ideas that we can use in our mathematics classes.


Couldn’t make the session?  Check out this video from David Carney on Plickers!


Session Materials

Karma and Julie’s presentation

Plickers Video Demos

Edulastic Teacher Training Hub

Teacher Showcase: Pixar Studios? Meet Karma Vince!

Arbor Hills math teacher Karma Vince jumps into Khan Academy’s Pixar in a Box to energize her lessons on shrinking and stretching!

20150902_101652
Karma Vince introduces concepts to her seventh grade math class.

As STEM education initiatives have grown in popularity over recent years, efforts have sprouted across the country to engage kids in those fields of study. Over the past week, Khan Academy, a champion of free science and math education, debuted an educational partnership with Pixar Animation Studios to jump into the trend. The result is Pixar in a Box, an online series of courses that teach students the math and science behind beloved movies like Toy Story and Monsters, Inc. Students entering “the box” can complete simple lessons that teach them the skills needed to use computers to animate actions, design characters, or light scenes, and the presenters in those lessons continually emphasize the foundation of all their work: math. It’s that foundation the prompted Karma Vince to jump right in and see what cool toys Pixar has placed in the box.

pixar-1000x576
Happy Pixar animators introduce Pixar in a Box on Khan Academy.

On a rainy Wednesday, Karma was working on the Stretching and Shrinking unit with her seventh grade math students. After a warm-up of fraction division exercises, students moved into the core content of the class, but as this stage began, Karma sidelined to introduce Pixar in a Box through their five-minute welcome video which generated excitement and outlined the lesson approaches. She encouraged students to explore this resource by following a link posted in Google Classroom and then earn extra credit by writing reviews of the lessons. Those reviews would include a summary of the lesson and recommendation on whether the entire class would benefit from watching it. One student raised his hand to ask, “Can we use stars for our reviews? Like four or five stars?” Karma smiled, “I think that would be excellent.” The student pounded his fist and shouted, “Yes!”

animated grid
The animation software Karma Vince uses to demonstrate x and y values in computer animation

But the best part of this lesson was yet to come. Karma next played a short demonstration of animation software that explained how coordinate systems were used to move simple animated figures. The all-familiar x and y axes appeared, and the narrator explained how manipulating these values manipulated the figure. A slight preview of the content of Pixar in a Box was revealed, connecting the math these students knew to the movies they use to dream.

20150902_101535
Students plot shapes on graph paper pasted into spiral notebooks.

And then came the homework. Students opened their spirals to discuss the shapes they had drawn on coordinate planes, shapes given cute names like “Lump” and “Wump.” They entered into discussion with Karma about how these simple geometric characters were similar or not and how x/y rules governed those relationships. The students raised hands often and helped each other build the concepts of similarity and proportionality that formed the basis of Karma’s shrinking and stretching unit. They watched her manipulate the SmartBoard images as they examined their own, drawn on graph paper and pasted into their spirals. The exchange was energetic and engaging.

Pixar-grass-border-1920x1080
Part of a Pixar in a Box lesson showing parabolas used to create blades of grass in the movie Brave

But the payoff came late in the lesson. During the discussion of x/y values governing shrinking and stretching, Karma discussed a simple computer function. On an image, one can click the corner and drag to expand the image without distorting it. In other words, the dragging increases or decreases the x and y values in proportion to create a similar shape. Once she made that connection, seventh grader David Dubiel raised his hand to exclaim, “Computers are literally just math. They’re nothing but math!” Karma smiled and agreed.

And that was it. Karma had started her students in the exciting, glitzy world of Pixar, moved them into simple animation demonstrations, onto the coordinate planes of junior high math, and back to the computer-driven world of Pixar with grace. David’s spark of understanding was the gift Karma hoped to give to each of these students, a gift that Pixar will help expand when they explore the online world of Pixar in a Box. As David said, computers are “literally just math.”

20150902_101556
Karma Vince demonstrating proportionality and similarity.

As we seek to engage our students while remaining true to our content standards, we often struggle to find moments that make the concepts authentic, to show students these concepts alive and kicking in the adult world. But more than that, we struggle to merge that authenticity with excitement. The simple partnership of a master Sylvania teacher and the creative geniuses at Pixar made that excitement possible. And as the rain pounded darkly outside of Arbor Hills on this dreary Wednesday, a group of students realized that they could enter the imaginative world of toys and monsters through the math that teachers like Karma give them every day.

TS Sequence Slide-Vince.jpg

Explore these links for more!

Pixar in a Box Reviews from Karma Vince’s Students

Pixar in a Box on Khan Academy

Pixar in a Box Introduction Video on YouTube

“Pixar Teaches Kids the Math Behind Movies in an Online Course” from ABC News